有些论文要求统计图形为黑白灰色,而Stata软件默认的彩色并不符合要求。本文分享:(1)第三方黑白灰Scheme;(2)预览所有Scheme的方法。
blindschemes
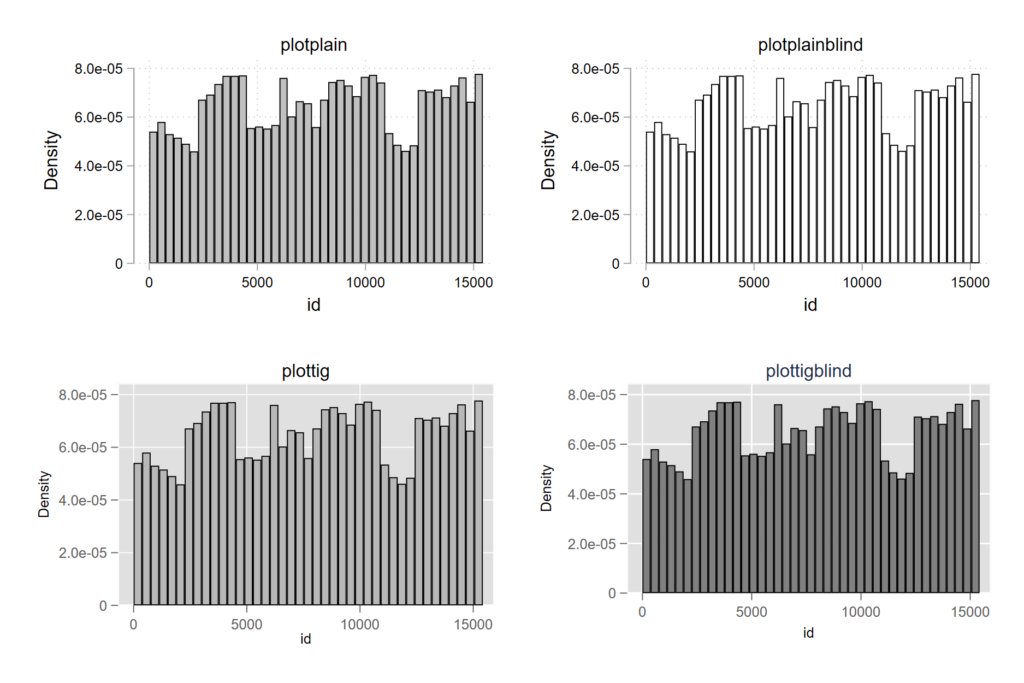
blindschemes是Stata第三方命令,内置了plotplain、plotplainblind、plottig和plottigblind四个黑白灰主题,预览如下:
安装方式如下:
ssc install blindschemes
预览所有已安装Scheme
该方法分为两个步骤:第一,获取所有Scheme名称;第二,循环生成图形。
使用如下命令获取所有Scheme:
graph query, schemes
结果类似如下:
Available schemes are

    plotplain
    plotplainblind
    plottig
    plottigblind
    s2color        see help scheme_s2color
    s2mono         see help scheme_s2mono
    s2manual       see help scheme_s2manual
    s2gmanual      see help scheme_s2gmanual
    s2gcolor       see help scheme_s2gcolor
    s1color        see help scheme_s1color
    s1mono         see help scheme_s1mono
    s1rcolor       see help scheme_s1rcolor
    s1manual       see help scheme_s1manual
    sj             see help scheme_sj
    economist      see help scheme_economist
    s2color8       see help scheme_s2color8
    meta
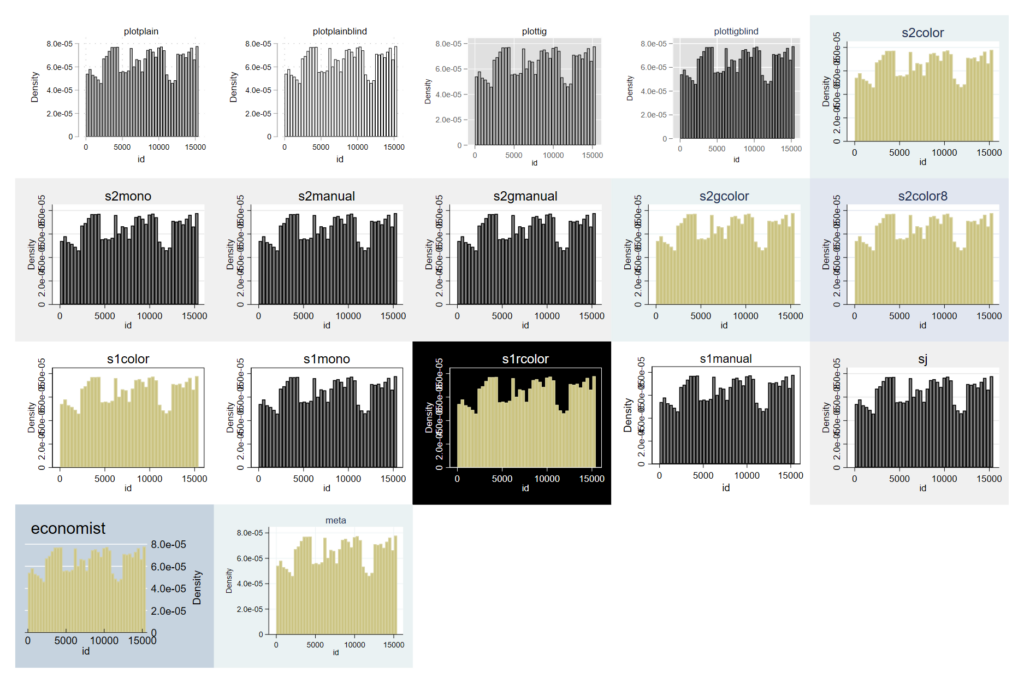
使用如下命令生成预览图形:
local schemes plotplain plotplainblind plottig plottigblind ///
	s2color s2mono s2manual s2gmanual s2gcolor s2color8 ///
	s1color s1mono s1rcolor s1manual sj economist meta
local plots

foreach scheme of local schemes {
	hist id, title(`scheme') scheme(`scheme')
	local plots `plots' `scheme'.gph
	graph save `scheme', replace
}
graph combine `plots'
生成图形例如: