本文档翻译自:Truly reproducible reporting | New in Stata 16
Stata的报告生成命令允许您创建完整的Word®、Excel®、PDF和HTML文档,其中包括格式化文本,以及Stata生成的摘要统计信息、回归结果和图形。
Stata用于创建报告的命令有两种:
- 动态文档命令:这些命令创建包含Stata命令完整输出的文本文件、HTML文件和Word文档。您可以使用Markdown文本格式语言自定义报表的外观。
- put* 命令——putdocx、putpdf、和putexcel:这些命令创建Word文档、PDF和Excel文件,将Stata命令的结果插入到文档中的格式化文本和表格中。
我们将在下面说明这些命令的区别。
无论您选择动态文档命令还是put*命令,都可以创建以下特性的文档:
- 可重复:Stata使可重复的研究变得容易。例如,使用version 16命令,您今天运行的任何命令都将在10年、20年或更长时间后产生相同的结果。使用datasignature命令,您可以验证数据是否没有更改。通过将这些用于实现可重复的工具加入到创建报告的do文件或文本文件中,这些报告也是可重复的。你能够随时重新运行命令并重新创建报告。
- 动态:也许你需要每月运行相同的报告,根据新数据更新结果。只需重新运行使用更新的数据集创建报告的命令。报告中的所有Stata结果将自动更新。
在Stata 16中,我们使您更容易生成报告。具体而言,我们增加了以下内容:
- dyndoc 和markdown 命令现在除了创建以前创建的HTML文档之外,还创建Word文档。现在,您可以轻松地将完整的Stata输出和图形与标记格式的文本合并,以创建自定义的Word文档。
- Do文件编辑器现在为Markdown语言元素提供语法高亮显示。
- 现在,putdocx命令允许你设计页眉、页脚、页码和超链接。它允许你控制页边距。它还使编写大型文本块变得更容易,包括包含多个段落的文本块。
- html2docx命令将HTML文档(包括CSS)转换为Word文档。
- docx2pdf命令将Word文档转换为PDF。
此外,Stata所有新的和以前存在的报告功能现在都记录在新的Stata报告参考手册(Stata Reporting Reference Manual)中。该手册包括许多新示例,这些示例演示了有关自定义使用Stata创建的Word、PDF、Excel和HTML文档的工作流,并提供了指导。
Let’s see it work
为了展示创建报告有多容易,我们将展示每个命令的作用,并在此过程中演示新功能。
动态文档命令
要使用动态文档命令创建报告,我们首先编写一个文本文件,其中包含Stata代码和要写入文档的文本。
我们使用动态标记来处理Stata代码,并将结果Stata输出嵌入到文本文件、HTML文件或Word文档中。我们可以使用带有动态标记的属性来修改输出。例如,我们可以在不输出命令的同时嵌入Stata输出。当我们将这些动态标记与Markdown格式的文本相结合时,我们可以创建格式良好的HTML或Word报告。
创建HTML文档
为了证明这一点,我们创建了一份关于高血压的报告,其中包括逻辑回归的输出和使用marginsplot创建的预期概率图。下面是我们的文本文件,包括形如<<dd…>>的Stata动态标记和Markdown格式文本。
<<dd_version: 2>>
<<dd_include: header.txt>>
<<dd graph: ...>
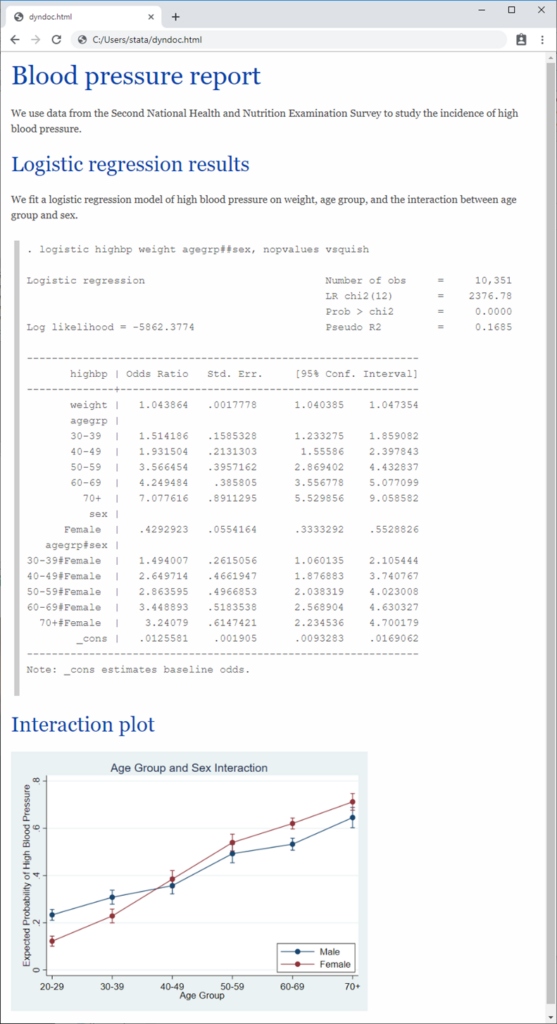
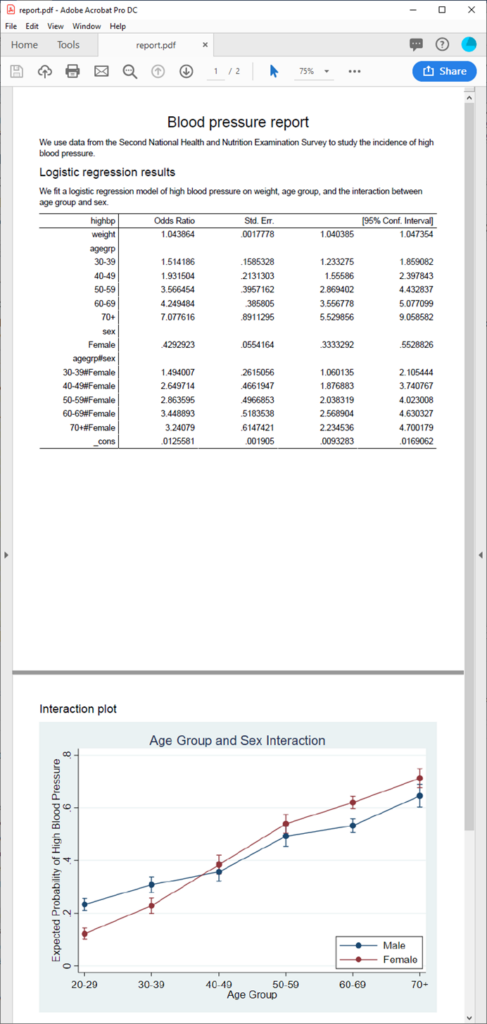
Blood pressure report
===============================================================
We use data from the Second National Health and Nutrition Examination Survey
to study the incidence of high blood pressure.
<<dd_do:quietly>>
webuse nhanes2, clear
<</dd_do>>
##Logistic regression results
We fit a logistic regression model of high blood pressure on
weight, age group, and the interaction between age group and sex.
~~~
<<dd_do>>
logistic highbp weight agegrp##sex, nopvalues vsquish
<</dd_do>>
~~~
##Interaction plot
<<dd_do:quietly>>
margins agegrp#sex
marginsplot, title(Age Group and Sex Interaction)
ytitle(Expected Probability of High Blood Pressure)
legend(ring(0) bplacement(seast) col(1))
<</dd_do>>
<<dd_graph: saving("interaction.png") replace height(400)>>
在文本文件的顶部,我们指定了转换文本文件所需的最低版本。我们还包括了header.txt文件,其中包含用于格式化文档的HTML代码。
我们用等号(==)表示报告标题,用双井号(##)表示节标题。此外,我们对要执行的Stata命令使用<<dd_do>>动态标记,但我们指定了quietly 属性以移除webuse和margins的输出。
为了生成HTML格式报告,我们键入
dyndoc dyndoc.txt
这将创建以下dyndoc.html文件:
创建Word文档
我们可以通过键入以下命令,从文本文件创建Word文档
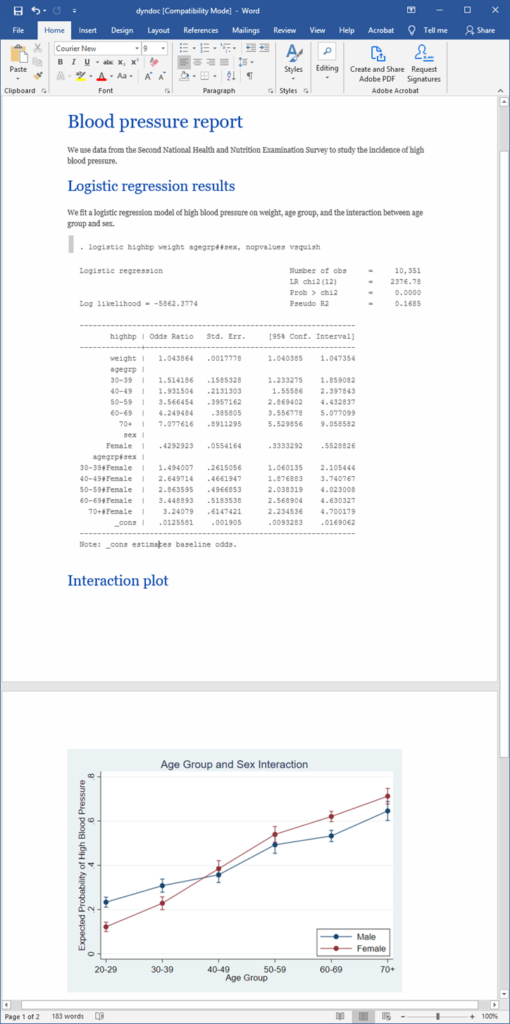
dyndoc dyndoc.txt, docx
这将创建以下dyndoc.docx文件:
更改CSS及更改样式
在上面的例子中,dyndoc.html使用了CSS样式表stmarkdown.css来控制HTML元素的外观。dyndoc.docx也保留了这些外观。
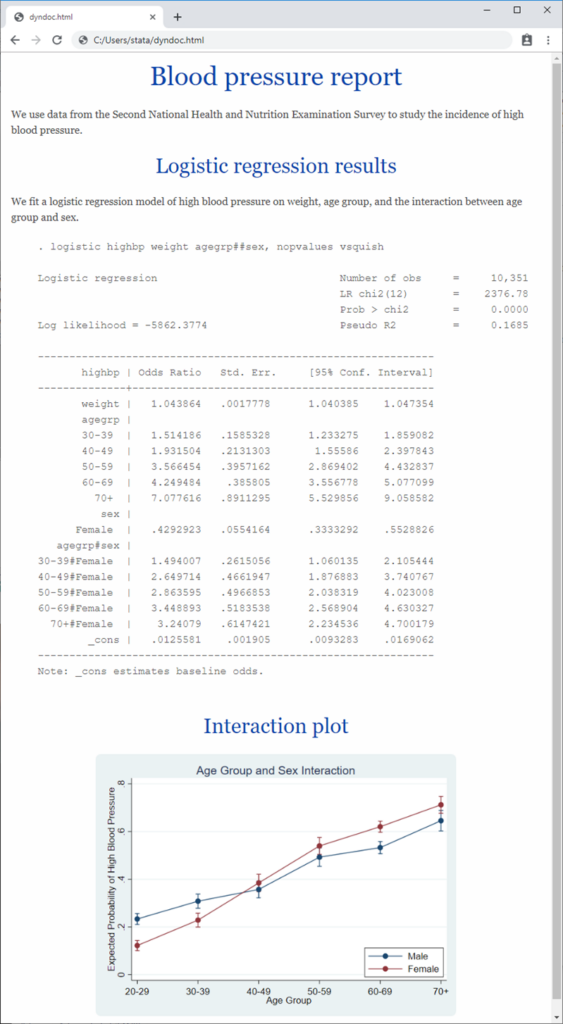
通过更改stmarkdown.css,我们可以很容易地改变dyndoc.html的样式——例如标题、代码块和图像的对齐方式。更改stmarkdown.css后,只需刷新在浏览器中刷新dyndoc.html即可看到改变后的效果。
我们可以运行以下命令以生成使用新外观的dyndoc.docx:
dyndoc dyndoc.txt, docx replace
或者,我们可以通过以下命令直接将我们的HTML文件转化为DOCX文件:
html2docx dyndoc.html, replace
查看 [RPT] Dynamic documents intro以了解更多关于将Stata输出嵌入在文本、HTML和Word文档的内容。
put* 命令
使用putdocx、putpdf和putexcel 能够创建Word、PDF和Excel格式的自定义报告。这些命令允许你格式化输出的表格和文字的布局与内容。
下面是一个创建Word文档的例子。
创建Word文档
运行Do文件中的以下命令,我们可以创建与之前一个在内容上相同的文档:
webuse nhanes2, clear

putdocx begin

// Add a title
putdocx paragraph, style(Title)
putdocx text ("Blood pressure report")

putdocx textblock begin
We use data from the Second National Health and Nutrition Examination Survey
 to study the incidence of high blood pressure.
putdocx textblock end

// Add a heading
putdocx paragraph, style(Heading1)
putdocx text ("Logistic regression results")

putdocx textblock begin
We fit a logistic regression model of high blood pressure on
 weight, age group, and the interaction between age group and sex.
putdocx textblock end

logistic highbp weight agegrp##sex, nopvalues vsquish

// Add the coefficient table from the last estimation command
putdocx table results = etable

putdocx paragraph, style(Heading1)
putdocx text ("Interaction plot")

margins agegrp#sex
marginsplot, title(Age Group and Sex Interaction)
        ytitle(Expected Probability of High Blood Pressure)
	legend(ring(0) bplacement(seast) col(1))
graph export interaction.png, replace
putdocx paragraph, halign(center)

// Add the interaction plot
putdocx image interaction.png

putdocx save report1, replace
在上述例子中,putdocx 命令被用于开始创建文档、添加标题及其他文字、纳入估计结果和添加统计图形。运行这些命令后,我们生成了report1.docx。

有时候我们想要进一步自定义文档。我们可以使用额外的putdocx 命令创建一个包含页眉、脚注、页码、标题、副标题和带有不同格式的节。此外,我们可以添加多个文件,并将Stata的功能与Word的功能交互。
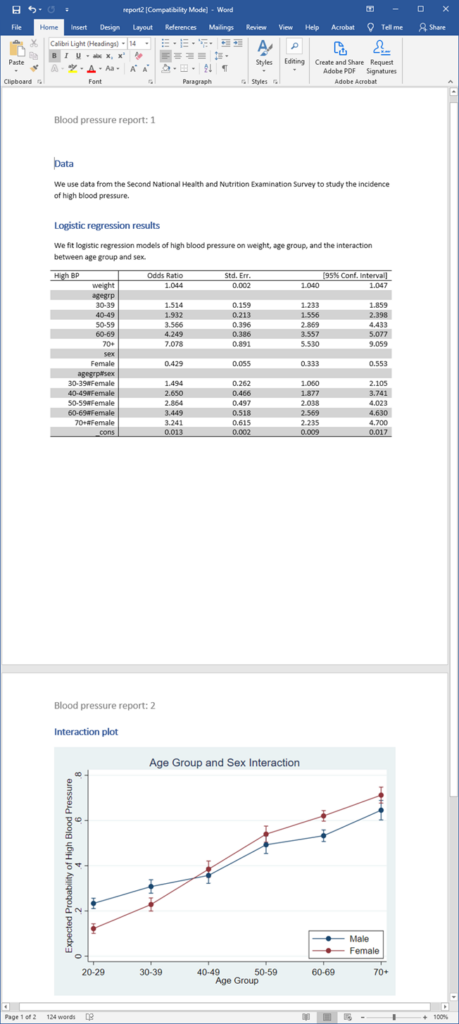
例如,我们可以创建如下do文件,以生成包含标题、页码和格式化回归结果表格的Word文档。
webuse nhanes2, clear

// Create a document with a header
putdocx begin, header(head)

// Define the header content, and include page numbers
putdocx paragraph, toheader(head) font(,14)
putdocx text ("Blood pressure report: ")
putdocx pagenumber

putdocx paragraph, style(Heading1)
putdocx text ("Data")

putdocx textblock begin
We use data from the Second National Health and Nutrition Examination Survey
 to study the incidence of high blood pressure.
putdocx textblock end

putdocx paragraph, style(Heading1)
putdocx text ("Logistic regression results")

putdocx textblock begin
We fit logistic regression models of high blood pressure on
 weight, age group, and the interaction between age group and sex.
putdocx textblock end

logistic highbp weight agegrp##sex, nopvalues vsquish
putdocx table results = etable

// Add a background color to alternating rows of the table
putdocx table results(3 5 7 9 11 13 15 17,.), shading(lightgray)

// Format the estimation results to have three decimal places
putdocx table results(2/17,2/5), nformat(%5.3f)

putdocx table results(1,1) = ("High BP")

putdocx paragraph, style(Heading1)
putdocx text ("Interaction plot")

margins agegrp#sex
marginsplot, title(Age Group and Sex Interaction)
        ytitle(Expected Probability of High Blood Pressure)
	legend(ring(0) bplacement(seast) col(1))
graph export interaction.png, replace
putdocx paragraph, halign(center)

// Specify the height of the image to be 5 inches
putdocx image interaction.png, height(5 in)

putdocx save report2, replace
运行do文件后,我们生成了以下Word文档:
查看[RPT] putdocx intro以了解更多。
创建PDF
我们可以创建内容与先前一样的PDF。我们将修改先前的docx1.do文件,将putdocx 替换为putpdf,并作一些微小的修改:
version 16
webuse nhanes2, clear

// Create a PDF document for export
putpdf begin

// Add a title, and center it horizontally
putpdf paragraph, font(,20) halign(center)
putpdf text ("Blood pressure report")

putpdf paragraph
putpdf text ("We use data from the Second National Health and Nutrition ")
putpdf text ("Examination Survey to study the incidence of high blood pressure.")

putpdf paragraph, font(,16)
putpdf text ("Logistic regression results")

putpdf paragraph
putpdf text ("We fit a logistic regression model of high blood pressure on ")
putpdf text ("weight, age group, and the interaction between age group and sex.")

logistic highbp weight agegrp##sex, nopvalues vsquish

// Export the table of estimation results
putpdf table results = etable

// Begin the following content on a new page
putpdf pagebreak
putpdf paragraph, font(,16)
putpdf text ("Interaction plot")

margins agegrp#sex
marginsplot, title(Age Group and Sex Interaction)
        ytitle(Expected Probability of High Blood Pressure)
        legend(ring(0) bplacement(seast) col(1))
graph export interaction.png, replace

// Add the interaction plot and center the image
putpdf paragraph, halign(center)
putpdf image interaction.png

putpdf save report, replace
执行这个do文件后,我们得到了report.pdf:
注意到,putpdf命令组与putdocx命令组非常相似,包含了一套用于导出文本、表格和图片的命令。
使用putpdf命令组,我们可以设置文档页边距和表格边距大小。除此之外,我们可以改变图表的大小,并将文档分为若干布局不同的节。
查看[RPT] putpdf intro以了解更多。
创建Excel文件
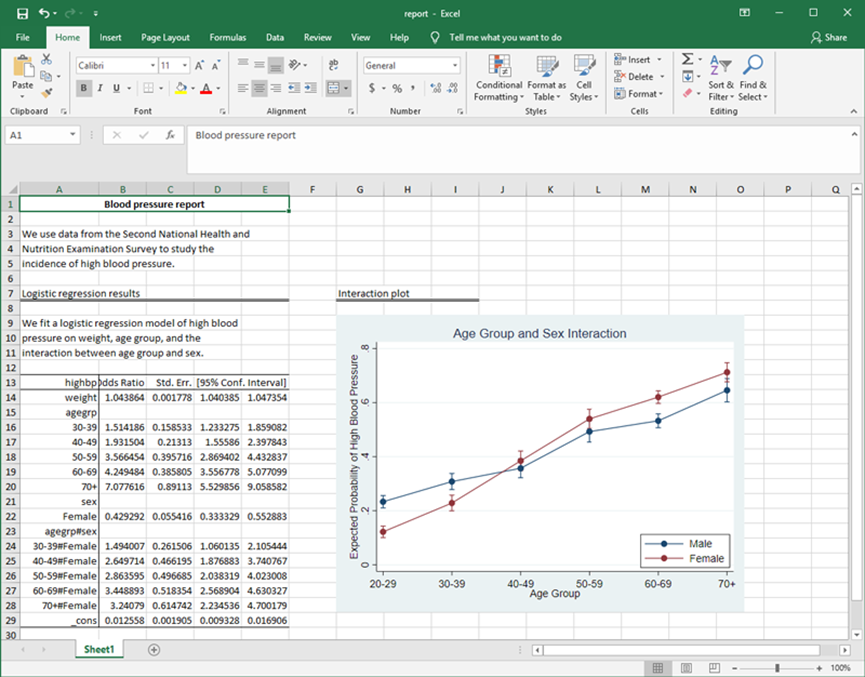
最后,我们将演示如何将Stata结果和图形导出到Excel文件。我们可以使用下面的do文件创建Excel格式的血压报告:
version 16
webuse nhanes2, clear

// Set the report.xlsx workbook for export
putexcel set report.xlsx, replace

// Add a title
putexcel A1 = "Blood pressure report", bold
putexcel A1:E1, border(bottom, thick) merge hcenter

putexcel A3 = "We use data from the Second National Health and "
putexcel A4 = "Nutrition Examination Survey to study the "
putexcel A5 = "incidence of high blood pressure."

// Add a heading for the regression results
putexcel A7 = "Logistic regression results"
putexcel A7:E7, border(bottom, double)

putexcel A9 = "We fit a logistic regression model of high blood"
putexcel A10 = "pressure on weight, age group, and the "
putexcel A11 = "interaction between age group and sex."

logistic highbp weight agegrp##sex, nopvalues vsquish

// Export the table of estimation results
putexcel A13 = etable

putexcel D13:E13, merge

putexcel G7 = "Interaction plot"
putexcel G7:I7, border(bottom, double)

margins agegrp#sex
marginsplot, title(Age Group and Sex Interaction)
        ytitle(Expected Probability of High Blood Pressure)
	legend(ring(0) bplacement(seast) cols(1))
graph export interaction.png, replace width(550) height(400)

// Export the interaction plot
putexcel G9 = image(interaction.png)
putexcel save
我们可以使用putexcel命令来指定文本和结果所在的单元格。示例代码中也包含了设置表格元素(如单元格边框)格式的说明。
执行上述do文件后,我们得到了以下Excel文件:
我们可以进一步自定义这个文档,例如格式化统计量、修改列标签、改变字体对齐方式。通过几个额外的putexcel命令,我们可以完全从Stata内部定制最终报告。
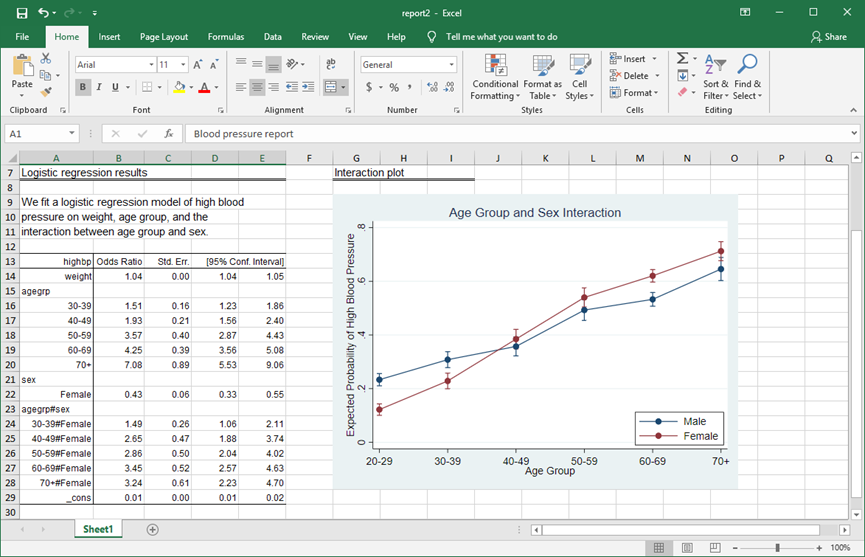
在下面这个示例中,我们指定font("Arial Narrow", 11)来使用不同的字体类型和大小,我们加入nformat(number_d2)选项来格式化估计结果为两位小数。
webuse nhanes2, clear

version 16
putexcel set report2.xlsx, replace

putexcel A1 = "Blood pressure report", bold
putexcel A1:E1, border(bottom, thick) merge hcenter

putexcel A3 = "We use data from the Second National Health and "
putexcel A4 = "Nutrition Examination Survey to study the "
putexcel A5 = "incidence of high blood pressure."

putexcel A7 = "Logistic regression results"
putexcel A7:E7, border(bottom, double)
putexcel A9 = "We fit a logistic regression model of high blood"
putexcel A10 = "pressure on weight, age group, and the "
putexcel A11 = "interaction between age group and sex."

// Specify the font type and size
putexcel A1:A11, font("Arial Narrow",11)

logistic highbp weight agegrp##sex, nopvalues vsquish

// Export the table of estimation results
putexcel A13 = etable

// Format statistics to have two decimal places
putexcel B14:E29, nformat(number_d2)

putexcel A13:E29, font("Arial Narrow",9)
putexcel A15, left
putexcel A21, left
putexcel A23, left

// Merge columns with the C.I. label.
putexcel D13:E13, merge

putexcel G7 = "Interaction plot", font("Arial Narrow",11)
putexcel G7:I7, border(bottom, double)

margins agegrp#sex
marginsplot, title(Age Group and Sex Interaction)
        ytitle(Expected Probability of High Blood Pressure)
	legend(ring(0) bplacement(seast) cols(1))
graph export interaction.png, replace width(550) height(400)

// Export the interaction plot
putexcel G9 = image(interaction.png)

putexcel save
执行上述do文件后,我们得到了report2.xlsx:
查看[RPT] putexcel以了解更多。
Tell me more
无论是Word、HTML、PDF还是Excel,Stata的报告功能都允许你运行命令、并将结果包括在自定义报告中。
在Stata Blog上查看dyndoc:Revealed preference: Stata for reproducible research。